TPO Profile chart
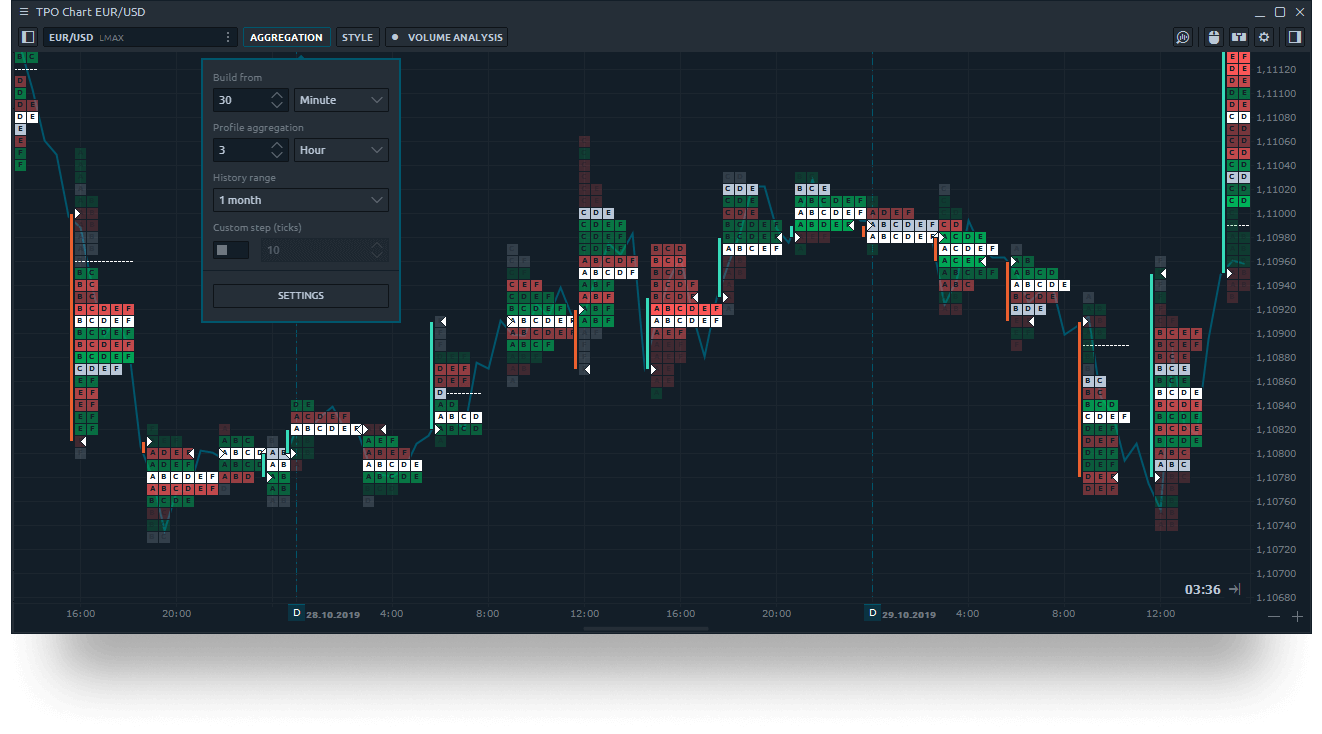
Aggregate your way
Specify any time periods in the aggregation settings to build the profile. Set a custom step of ticks for optimal profile view
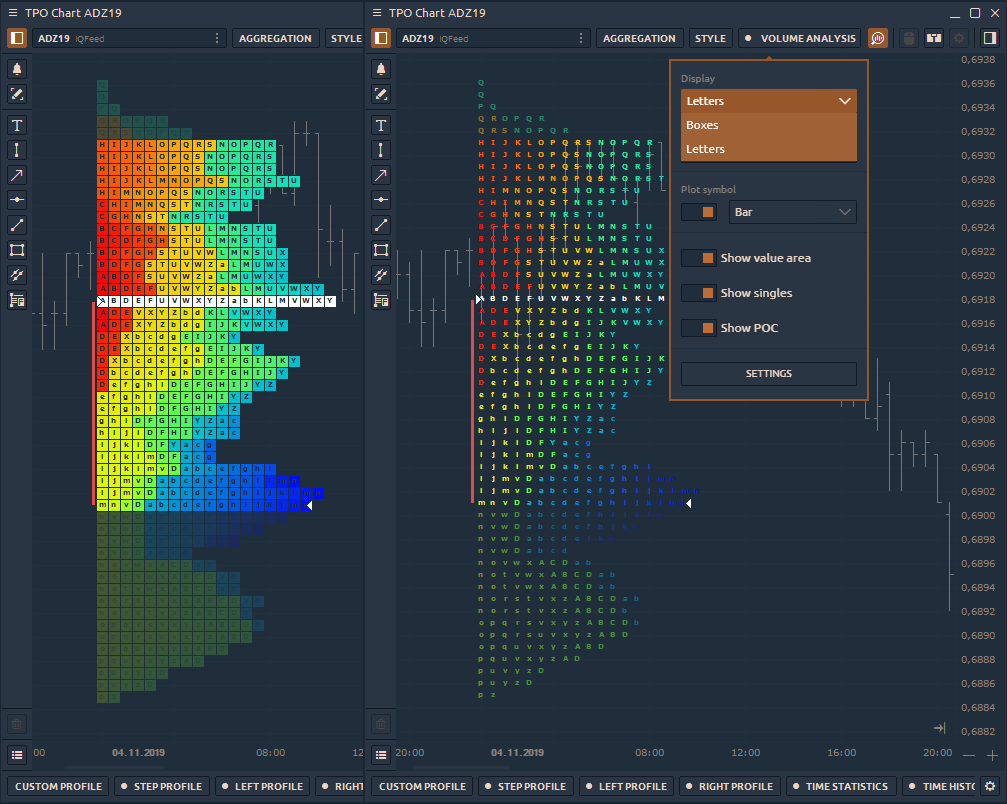
Visualisation & coloring
Choose any color scheme for both Boxed or Lettered view for better representation and analysis of the TPO profile
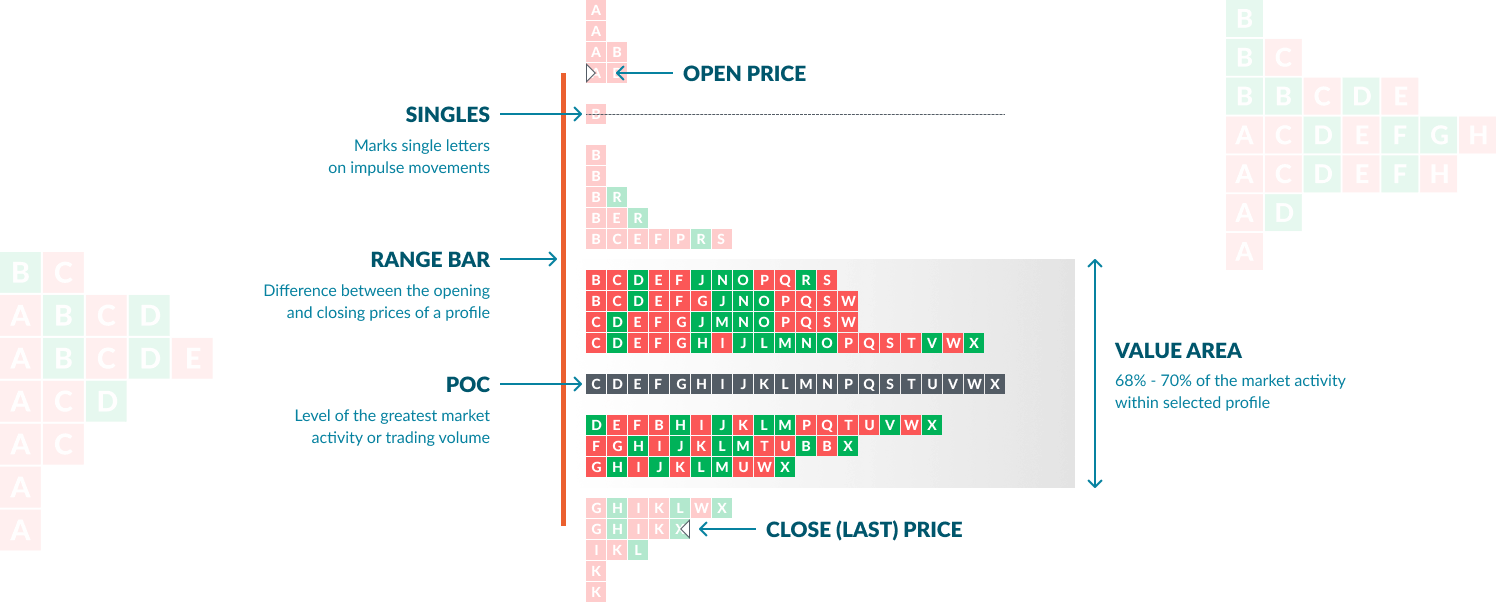
POC, Value area, Singles
Enable key elements of Trade Price Opportunity chart for more precise analysis as well as turn the POC Ray per each profile
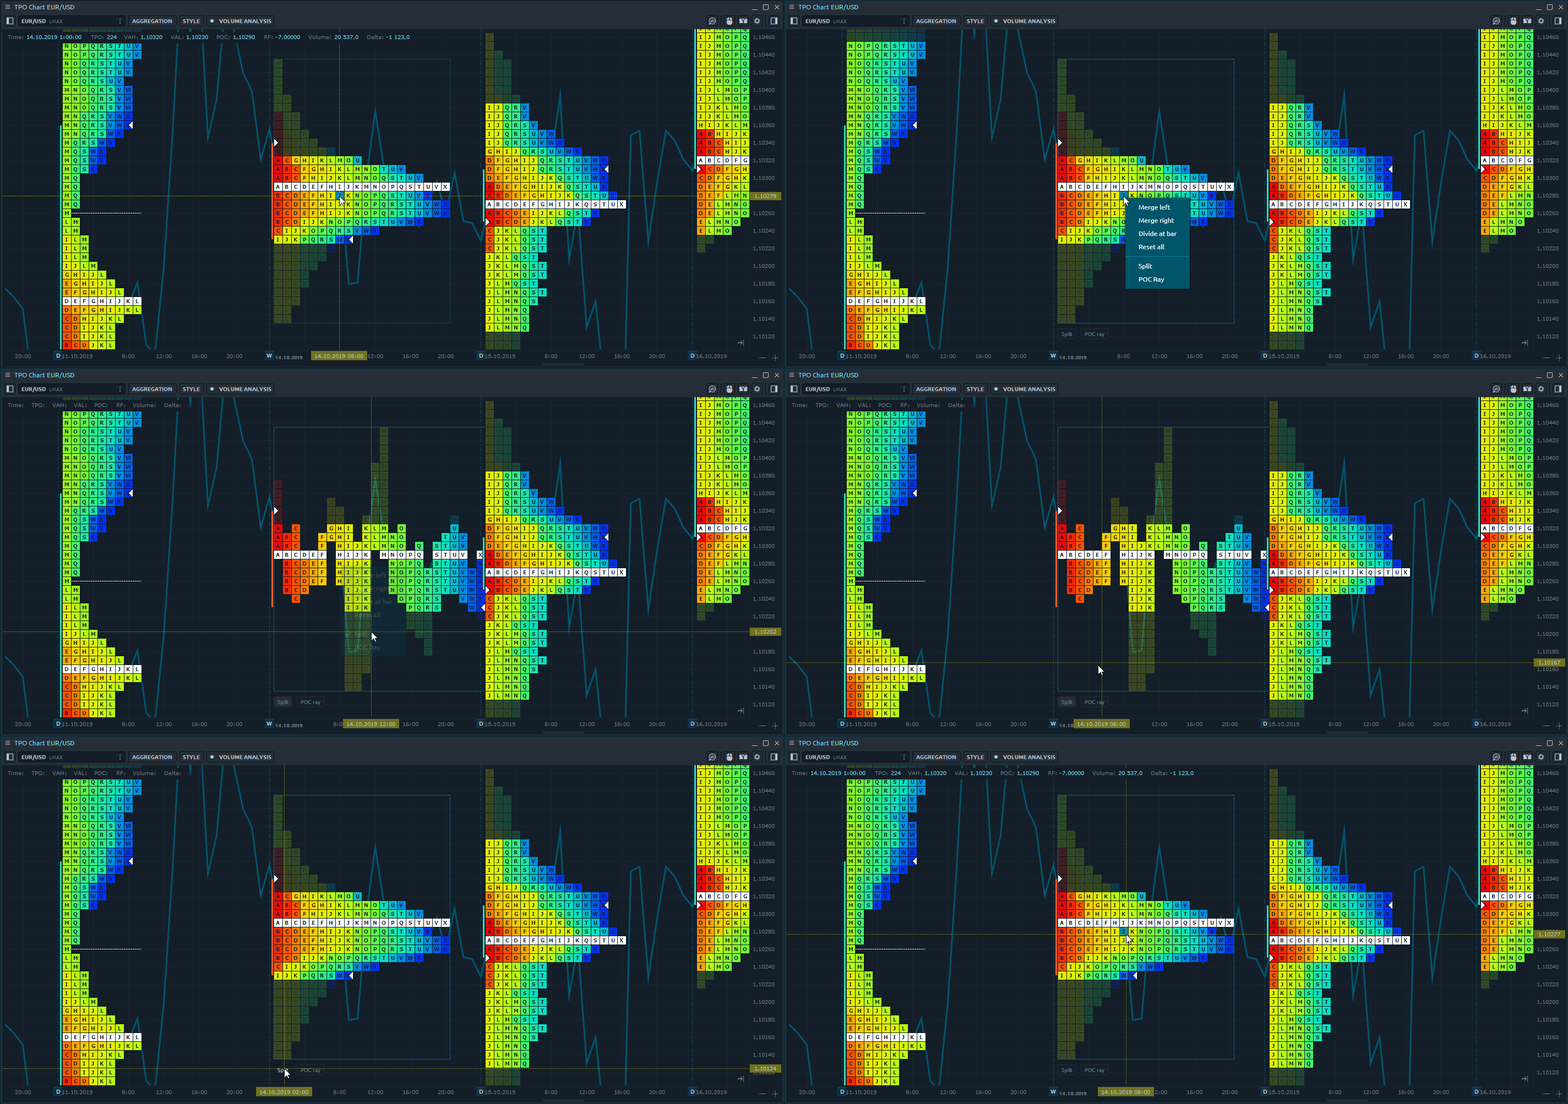
Full or partial split
Use splitting for a detailed analysis of profile information. Separate the profile into each column or divide it into two by the selected bar
Buy the Quantower All-in-one license and get all these functionalities (and more) starting from $70 monthly
An All-in-one license gives you access to even more professional features, including all updates and future releases of new advanced functions
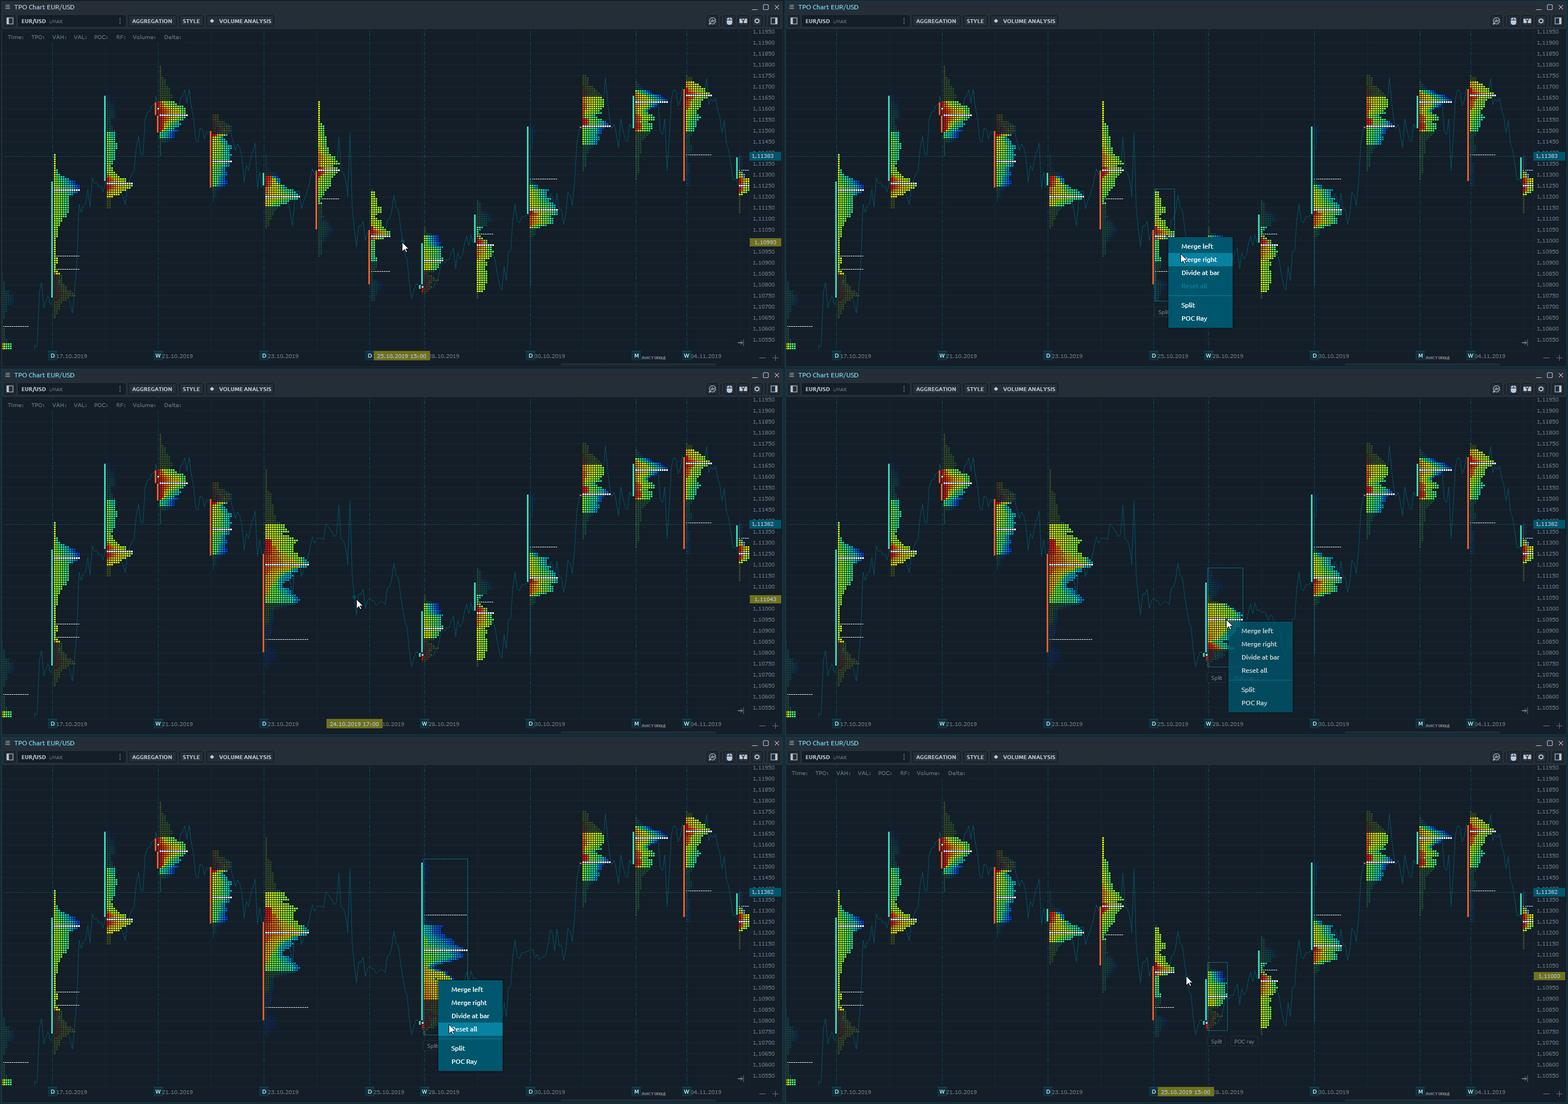
Merging profiles
Combine several profiles into one using the handy context menu options
Standard chart layer
Display the standard chart of any style right under the TPO profiles and apply any drawings for technical analysis

Volume analysis tools
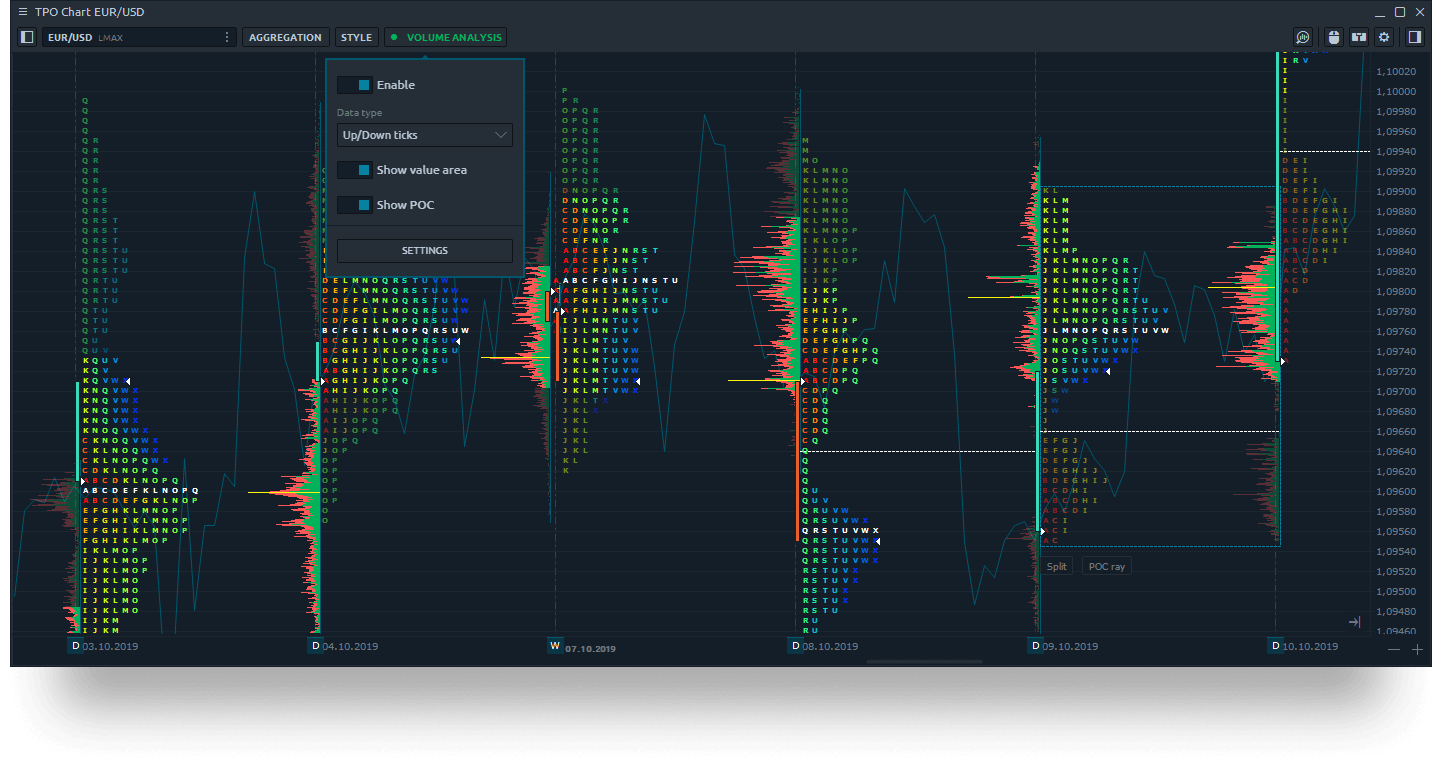
TPO profiles are used on their own to find areas of support and resistance, and can also be used in conjunction with volume profiles
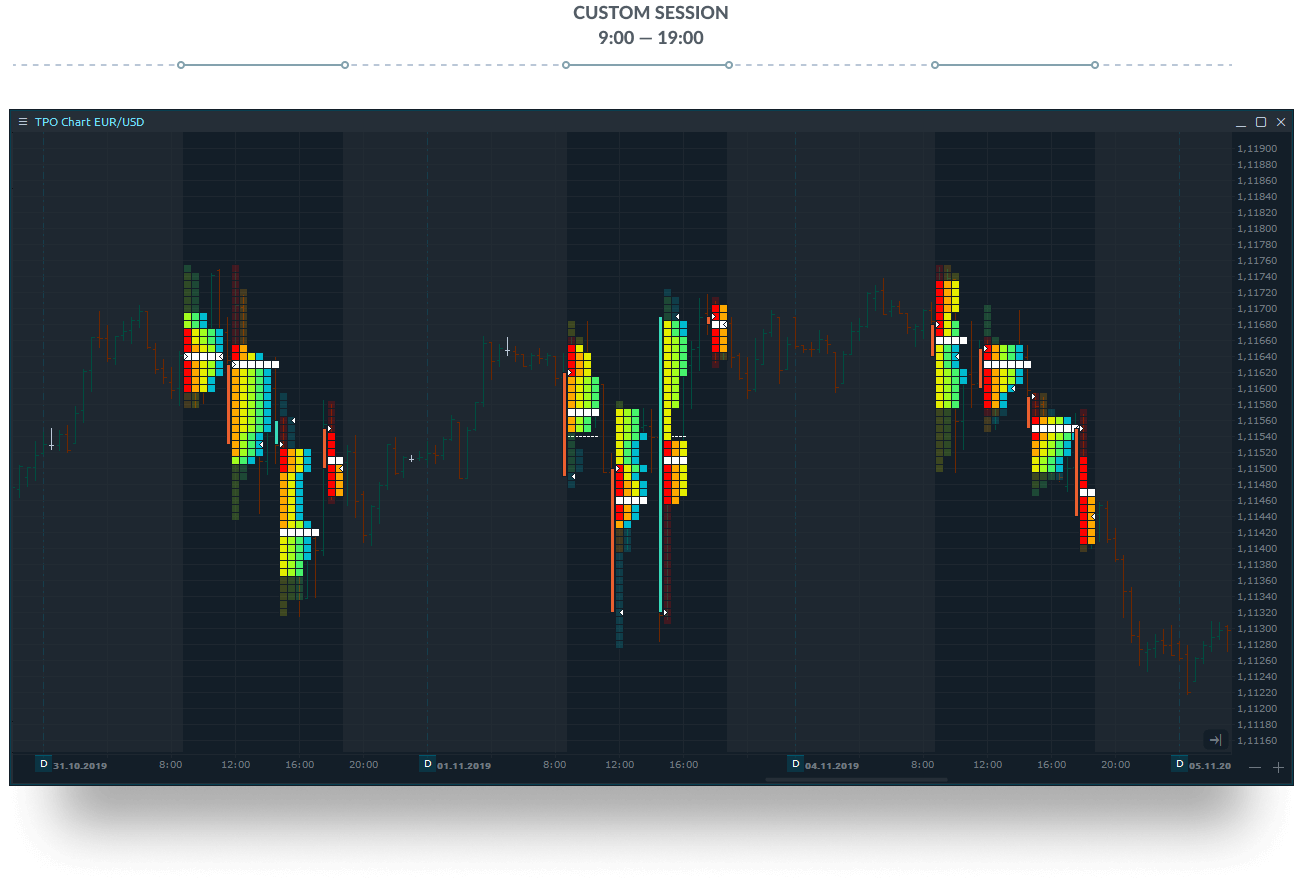
Session time
Set the custom time range for the necessary trading session and the profile will be built within this range. The rest of the time will not be taken into account
